-
Charlottesville
- (434) 296-5111
-
Great Falls
- (703) 759-3624
-
McLean
- (703) 288-2808
Georgetown Learning Centers Blog
Interpreting The College Board’s 2013-14 Results
The College Board recently released a comprehensive report on the PSAT, SAT, and Advanced Placement programs, giving a detailed look at national and statewide performance for the 2013-14 school year. We wanted to share some of the information from this report and highlight Virginia’s performance in these three popular and important academic programs.
PSAT/NMSQT: Emphasizing Early Assessment
The College Board considers the PSAT an important assessor of student progress early in high school. While students and parents often think about the PSAT in terms of National Merit Scholarship awards and recognition, it also plays an important role in identifying students who are likely to succeed in higher-level courses (such as the AP program), as well as those students who may need additional support to achieve college readiness.
“Approximately 40% of students with potential for AP success did not take any AP courses.”
Nationwide, 3.7 million students (mostly from the classes of 2015 and 2016) took the PSAT last year, setting a new record. Nearly 500,000 test takers from the class of 2016 achieved scores indicating the potential for success in Advanced Placement courses. However, schools and the College Board are having trouble steering those students into such courses; in the class of 2014, approximately 40% of students with potential for AP success did not take any AP courses.
In Virginia, 134,968 students took the PSAT last year. This included 63.6% of the class of 2016, substantially more than the national average of 38.3%. While it remains to be seen how test scores from sophomores will be used moving forward, it does appear that Virginia is ahead of the curve in terms of obtaining data on student readiness that might inform students’ decisions about AP courses and other upperclassmen concerns.
SAT: Responding to Growing Criticism
The SAT has been in the news frequently over the past several years, and the publicity has generally been negative. The ACT has surpassed the SAT in national popularity—though some of this may be attributed to the ACT’s partnerships with several states extending the test to all students—and The College Board announced a major SAT redesign in early 2014 intended to address some of the persistent criticism of the test.
For its part, The College Board seems to be responding to concerns about the test and competition from the ACT. Studies have indicated that students who apply to multiple colleges are substantially more likely to actually enroll somewhere, and The College Board has launched several initiatives (including fee waivers and weekday testing) designed to help high-achieving and low-income students overcome barriers to applications.
Despite competition from the ACT, the SAT is still growing in popularity. 1,672,395 students in the class of 2014 took the SAT, an increase of almost 1% compared to the class of 2013.
“54% of students who met the SAT’s benchmark score of 1550 completed a bachelor’s degree within 4 years, compared to only 27% of students who did not.”
Nationwide performance on the test was somewhat troubling. Only 42.6% of the class of 2014 met or exceeded the benchmark score of 1550 (out of 2400), which is associated with a high probability of first-year collegiate success. Students who meet this benchmark are significantly more likely to succeed. 78% enroll in four-year colleges, which tend to offer more comprehensive support and more opportunities, compared to just 46% of those who do not meet the 1550 benchmark. In addition, 54% of students who met The College Board’s benchmark completed a bachelor’s degree within 4 years, compared to only 27% of students who did not.
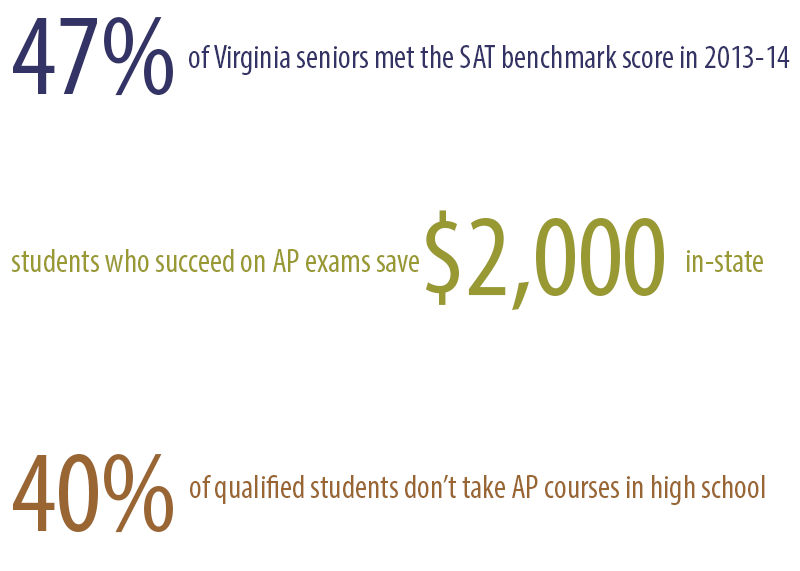
For Virginia’s class of 2014, the SAT was slightly less popular than in the previous year. Approximately 60,000 students took the SAT last year, a decrease of around 1%. However, Virginia students did outperform the national average in terms of meeting the SAT Career Readiness Benchmark, with 46.6% of students scoring 1550 or higher.
AP: Challenging Curriculum, Rewarding Results
The College Board’s Advanced Placement program is growing fairly quickly. 1,478,084 juniors and seniors took AP courses last year, a 3.8% increase from 2012-13. More students are also succeeding in AP courses (i.e. scoring 3, 4, or 5 on a test), with 13.2% of upperclassmen doing so in 2014 compared to just 7.6% in 2004.
In Virginia, 29.6% of upperclassmen took one or more AP exams in 2014, nearly 12% more than in 2004 and the sixth-highest rate in the country. At fourth in the nation, performance in Virginia also outpaced the national averages, with 19.2% of juniors and seniors scoring a 3, 4, or 5 in 2014. However, The College Board did highlight a concern for Virginia. 34% of Virginia’s class of 2014 did not take AP classes for which they were qualified based on their PSAT scores. Some of this can be attributed to schools which don’t offer AP courses in certain subjects, but many students are also not considering AP courses in which they could be successful.
“In Virginia, a student who scored 3 or higher on two AP exams would save an average of $2,000 in-state or $5,500 at a private college or university.”
Strong AP scores can confer several benefits. Many colleges and universities give credit for good scores, which can lead to faster graduation and reduced educational expenses for students. In Virginia, a student who scored 3 or higher on two AP exams would save an average of $2,000 in-state or $5,500 at a private college or university. AP exam performance is also linked to on-time college graduation. Students whose average AP scores are 3, 4, or 5 are 12-27% more likely to complete college on time compared to academically similar students.
The College Board’s reports include interesting information on many other topics, including national and state-by-state performance breakdowns by ethnicity and economic background. We encourage you to view these reports in order to stay up-to-date on these popular and influential academic programs.

Annie Burnquist
Founder
Georgetown Learning Centers
What do you think of The College Board’s recent report? Do these trends match what you’ve heard? Feel free to share your thoughts in the comments section below.
Would you like to share your thoughts?
Would you like to share your thoughts?
Leave a Reply
You must be logged in to post a comment.
0 Comments